Collegare un bottone ad un area nel senso che una volta selezionata e studiata un area, si puo' premere un bottone e poter selezionare un altra area da studiare senza perdere le informazioni della prima area. No non si conosce a priori l'area, la selezioni di volta in volta.
Il codice e' inserito nello script GUI, anche se e' un po' lungo, lo alleghero' alla fine di questo messaggio.
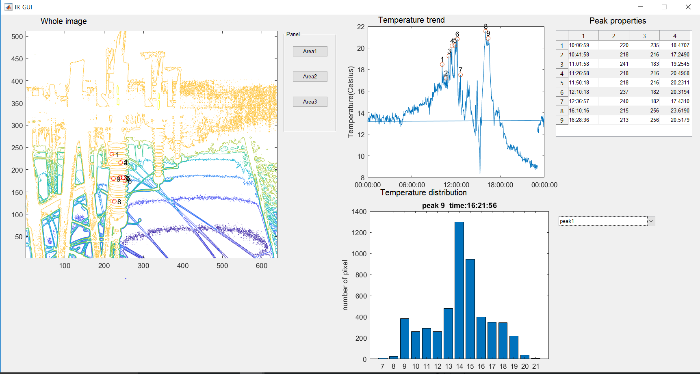
[img]C:\Users\HIVES\Desktop\Data%20analysis\IRCAmera[/img]
Questa e' l'interfaccia. Forse non si vedono bene ma accanto all'immagine termica ci sono i tre pulsanti che vorrei attivare.
function varargout = IR_GUI(varargin)
% IR_GUI MATLAB code for IR_GUI.fig
%      IR_GUI, by itself, creates a new IR_GUI or raises the existing
%      singleton*.
%
%      H = IR_GUI returns the handle to a new IR_GUI or the handle to
%      the existing singleton*.
%
%      IR_GUI('CALLBACK',hObject,eventData,handles,...) calls the local
%      function named CALLBACK in IR_GUI.M with the given input arguments.
%
%      IR_GUI('Property','Value',...) creates a new IR_GUI or raises the
%      existing singleton*.  Starting from the left, property value pairs are
%      applied to the GUI before IR_GUI_OpeningFcn gets called.  An
%      unrecognized property name or invalid value makes property application
%      stop.  All inputs are passed to IR_GUI_OpeningFcn via varargin.
%
%      *See GUI Options on GUIDE's Tools menu.  Choose "GUI allows only one
%      instance to run (singleton)".
%
% See also: GUIDE, GUIDATA, GUIHANDLES

% Edit the above text to modify the response to help IR_GUI

% Last Modified by GUIDE v2.5 28-May-2018 15:42:37

% Begin initialization code - DO NOT EDIT
gui_Singleton = 1;
gui_State = struct('gui_Name',       mfilename, ...
                   'gui_Singleton',  gui_Singleton, ...
                   'gui_OpeningFcn', @IR_GUI_OpeningFcn, ...
                   'gui_OutputFcn',  @IR_GUI_OutputFcn, ...
                   'gui_LayoutFcn',  [] , ...
                   'gui_Callback',   []);
if nargin && ischar(varargin{1})
    gui_State.gui_Callback = str2func(varargin{1});
end

if nargout
    [varargout{1:nargout}] = gui_mainfcn(gui_State, varargin{:});
else
    gui_mainfcn(gui_State, varargin{:});
end
% End initialization code - DO NOT EDIT


% --- Executes just before IR_GUI is made visible.
function IR_GUI_OpeningFcn(hObject, eventdata, handles, varargin)
% This function has no output args, see OutputFcn.
% hObject    handle to figure
% eventdata  reserved - to be defined in a future version of MATLAB
% handles    structure with handles and user data (see GUIDATA)
% varargin   command line arguments to IR_GUI (see VARARGIN)
% Create the data to plot.
RootMATFileName ='DataIR';
MaxNumMAT = 865;
cd('C:\Users\HIVES\Desktop\Data analysis\IRCAmera\Matfiles')
[filename, pathname, filterindex] = uigetfile('*.*', 'Pick 1st FLIR file');
cd(pathname)
videoFileName1='DataIR1';
TempD = load(videoFileName1);
Data1=TempD.DataIR1;

 handles.Data1=Data1;
 handles.current_data1 = handles.Data1;

  contourf(handles.Data1)
%  [c,h] = contourf(handles.Data1,200, 'LineStyle','none');
%         colorbar
[x,y]=ginput;
xx=round(x);
yy=round(y);

%first line
xx1=xx(1:2,1);
yy1=yy(1:2,1);
x1=min(xx1);
x2=max(xx1);
y1=min(yy1);
y2=max(yy1);

handles.x1=x1;
handles.current_data2 = handles.x1;
handles.x2=x2;
handles.current_data3 = handles.x2;
handles.y1=y1;
handles.current_data4 = handles.y1;
handles.y2=y2;
handles.current_data5 = handles.y2;

VideoIR{MaxNumMAT}.DataTemp = [];
VideoIR{MaxNumMAT}.DateTime = [];
VideoIR{MaxNumMAT}.ObjectParam = [];
VideoIR{MaxNumMAT}.Scaling = [];
VideoIR{MaxNumMAT}.FrameInfo =[];


AllDatatemp = zeros(512,640,865);
parfor kk = 1:MaxNumMAT
DataFileName = sprintf('%s%d',RootMATFileName, kk);
videoFileName =fullfile(pathname, DataFileName);
% %
 TempD = load(videoFileName);
% %
datatmp = sprintf('%s',DataFileName);
datatmptime = sprintf('%s_DateTime',DataFileName);
datatmpObjectParam = sprintf('%s_ObjectParam',DataFileName);
datatmpScaling = sprintf('%s_Scaling',DataFileName);
datatmpFrameInfo = sprintf('%s_FrameInfo',DataFileName);
%
% %
VideoIR{kk}.DataTemp = TempD.(datatmp); % eval(datatmp)
VideoIR{kk}.DateTime = TempD.(datatmptime);
VideoIR{kk}.ObjectParam = TempD.(datatmpObjectParam );
VideoIR{kk}.Scaling = TempD.(datatmpScaling);
VideoIR{kk}.FrameInfo = TempD.(datatmpFrameInfo);

 TempD =[];

 MaxT_Kelvin(kk)= max(max(VideoIR{kk}.DataTemp));
 MaxT1_Kelvin(kk) = max(max(VideoIR{kk}.DataTemp(x1:x2,y1:y2))); % first insulator profile

% %

Time(kk,:) = VideoIR{kk}.DateTime;

end

%from Kelvin to Celsius
 MaxT=MaxT_Kelvin-273.15;
 MaxT1=MaxT1_Kelvin-273.15;

handles.MaxT=MaxT;
handles.current_data6= handles.MaxT;

handles.MaxT1=MaxT1;
handles.current_data7= handles.MaxT1;

%frame time

t=Time(:,4:6);

%find peaks

[peak_value,peak_location] = findpeaks(MaxT1,'MinPeakHeight',17,'MinPeakDistance',10) ;
num_peak=length(peak_location);
text(peak_location+8,peak_value,num2str((1:numel(peak_value))'))

%position of the peaks of tempearture

VideoIR{MaxNumMAT}.DataTemp = [];
AllDatatemp1 = zeros(512,640,num_peak);
p=[];
q=[];
mx=[];
for kk = 1:num_peak
DataFileName1 = sprintf('%s%d',RootMATFileName, peak_location(1,kk));
videoFileName1 =fullfile(pathname, DataFileName1);
%
TempD = load(videoFileName1);
%
datatmp = sprintf('%s.%s','TempD',DataFileName1);
%
VideoIR{kk}.DataTemp = eval(datatmp);
%
clear TempD
%
AllDatatemp1(:,:,kk) = VideoIR{kk}.DataTemp;     %whole image
[mx_Kelvin(kk),Y(kk)] = max(max(AllDatatemp1(x1:x2,y1:y2,kk),[],1));
[mx_Kelvin(kk),X(kk)] = max(max(AllDatatemp1(x1:x2,y1:y2,kk),[],2));
end
mx=mx_Kelvin-273.15;

handles.AllDatatemp1=AllDatatemp1;
handles.current_data8 = handles.AllDatatemp1;

%MaxT verus time (not frame)

c=cellfun(@(x) num2str(x,'%02d'),num2cell(t),'UniformOutput',false);  %t contains the istants of the IR frames
d=strcat(c(:,1),':',c(:,2),':',c(:,3));

handles.d=d;
handles.current_data9 = handles.d;

 axes(handles.axes2);
plot(datenum(handles.d,'HH:MM:SS'),handles.MaxT1);   %first bushing area
ylabel('Temperature(Celsius)')
datetick('x','HH:MM:SS')
hold on

%add peaks on the trend of MaxT

d1=d(peak_location,1);

handles.d1=d1;
handles.current_data10 = handles.d1;

handles.peak_value=peak_value;
handles.current_data11 = handles.peak_value;

plot(datenum(handles.d1,'HH:MM:SS'),handles.peak_value,'o')
datetick('x','HH:MM:SS')
%
for i=1:num_peak
    num{i} = [num2str(i)];
end
handles.num_peak=num_peak;
handles.current_data12 = handles.num_peak;

handles.num=num;
handles.current_data13 = handles.num;

text(datenum(handles.d1,'HH:MM:SS')-0.01,handles.peak_value+0.5,num)


  %distribuition of probability

  for i=1:num_peak
   item_list{i}=['peak_' num2str(i)];
end
handles.popupmenu1.String=item_list;

% for sel_item=1:num_peak
%
%
% D=round(AllDatatemp1(x1:x2,y1:y2,sel_item)-273.15);
%
% [D1,N]=hist(D,unique(D));
% out=[N' sum((D1),2)];
%
% handles.out=out;
% handles.current_data6 = handles.out;
%
%  axes(handles.axes5);
%
% bar(handles.out(:,1),handles.out(:,2))
% xlabel('Celsius degree');
% ylabel('number of pixel');
% tit=strcat('peak',{' '},num2str(i),{' '},{' '},'time:',d1(i));
% title(tit);
% end

%display peak of temperature on the thermal image

axes(handles.axes1);
contour(handles.Data1)
hold on
z=length(X);
XX=X+x1;
YY=Y+y1;

handles.XX=XX;
handles.current_data14 = handles.XX;

handles.YY=YY;
handles.current_data15 = handles.YY;


%
% for j=1:z
%
%      plot(handles.XX(1,j),handles.YY(1,j),'r--o')
%      pause(0.5);
%      text(handles.XX(1,j)+8,handles.YY(1,j),num(1,j))
% end
% tab of peaks (frame, coordinates, temperature)

%make the peak table

TabM=[d1,num2cell(XX'),num2cell(YY'),num2cell(mx')];

handles.TabM=TabM;
handles.current_data16 = handles.TabM;

colnames = {'Time','X-axes', 'Y-axes', 'Tmax'};
Tab = uitable('Data', handles.TabM, 'ColumnName', colnames, ...
'Position', [1105 490 275 190]);

%
% Update handles structure
guidata(hObject, handles);

% UIWAIT makes IR_GUI wait for user response (see UIRESUME)
% uiwait(handles.figure1);


% --- Outputs from this function are returned to the command line.
function varargout = IR_GUI_OutputFcn(hObject, eventdata, handles)
% varargout  cell array for returning output args (see VARARGOUT);
% hObject    handle to figure
% eventdata  reserved - to be defined in a future version of MATLAB
% handles    structure with handles and user data (see GUIDATA)

% Get default command line output from handles structure


% --- Executes on selection change in popupmenu1.
function popupmenu1_Callback(hObject, eventdata, handles)
% hObject    handle to popupmenu1 (see GCBO)
% eventdata  reserved - to be defined in a future version of MATLAB
% handles    structure with handles and user data (see GUIDATA)
% Determine the selected data set.
str = get(hObject, 'String');
val = get(hObject,'Value');

sel_item=handles.popupmenu1.Value;
%figure 3
axes(handles.axes5);

for i=1:sel_item

D=round(handles.AllDatatemp1(handles.x1:handles.x2,handles.y1:handles.y2,i)-273.15);

[D1,N]=hist(D,unique(D));
out=[N' sum((D1),2)];

handles.out=out;
handles.current_data6 = handles.out;

bar(handles.out(:,1),handles.out(:,2))
xlabel('Celsius degree');
ylabel('number of pixel');
tit=strcat('peak',{' '},num2str(i),{' '},{' '},'time:',handles.d1(i));
title(tit);
end

%figure 2 trend of temperature
axes(handles.axes2);

plot(datenum(handles.d,'HH:MM:SS'),handles.MaxT1,'Color', [0 0.4470 0.7410]);   %first bushing area
ylabel('Temperature(Celsius)')
datetick('x','HH:MM:SS')
hold on
plot(datenum(handles.d1,'HH:MM:SS'),handles.peak_value,'r o')
datetick('x','HH:MM:SS')
text(datenum(handles.d1,'HH:MM:SS')-0.01,handles.peak_value+0.5,handles.num)

scatter(datenum(handles.d1(sel_item),'HH:MM:SS'),handles.peak_value(sel_item),'filled','r')
datetick('x','HH:MM:SS')
hold off

%figure 1 IR image: display peak
axes(handles.axes1);
%
dx=handles.x2-handles.x1;
dy=handles.y2-handles.y1;

handles.dx=dx;
handles.current_data17 = handles.dx;

handles.dy=dy;
handles.current_data18 = handles.dy;

%Display position of the selected peak in IR image and selected area rectangle

  contour(handles.Data1)
  hold on
  rectangle('position',[handles.x1,handles.y1,handles.dx,handles.dy],'LineWidth',0.5,'LineStyle','--')
  plot(handles.XX(1,sel_item),handles.YY(1,sel_item),'r o')
  text(handles.XX(1,sel_item)+8,handles.YY(1,sel_item),handles.num(1,sel_item))
  hold off

% Save the handles structure.
guidata(hObject,handles)
% Hints: contents = cellstr(get(hObject,'String')) returns popupmenu1 contents as cell array
%        contents{get(hObject,'Value')} returns selected item from popupmenu1


% --- Executes during object creation, after setting all properties.
function popupmenu1_CreateFcn(hObject, eventdata, handles)

% hObject    handle to popupmenu1 (see GCBO)
% eventdata  reserved - to be defined in a future version of MATLAB
% handles    empty - handles not created until after all CreateFcns called


% Hint: popupmenu controls usually have a white background on Windows.
%       See ISPC and COMPUTER.
if ispc && isequal(get(hObject,'BackgroundColor'), get(0,'defaultUicontrolBackgroundColor'))
    set(hObject,'BackgroundColor','white');
end


% --- Executes on button press in pushbutton1.
function pushbutton1_Callback(hObject, eventdata, handles)
% hObject    handle to pushbutton1 (see GCBO)
% eventdata  reserved - to be defined in a future version of MATLAB
% handles    structure with handles and user data (see GUIDATA)


% --- Executes on button press in pushbutton2.
function pushbutton2_Callback(hObject, eventdata, handles)
% hObject    handle to pushbutton2 (see GCBO)
% eventdata  reserved - to be defined in a future version of MATLAB
% handles    structure with handles and user data (see GUIDATA)


% --- Executes on button press in pushbutton3.
function pushbutton3_Callback(hObject, eventdata, handles)
% hObject    handle to pushbutton3 (see GCBO)
% eventdata  reserved - to be defined in a future version of MATLAB
% handles    structure with handles and user data (see GUIDATA)


% --- Executes on mouse press over axes background.
function axes1_ButtonDownFcn(hObject, eventdata, handles)
% hObject    handle to axes1 (see GCBO)
% eventdata  reserved - to be defined in a future version of MATLAB
% handles    structure with handles and user data (see GUIDATA)


% --- If Enable == 'on', executes on mouse press in 5 pixel border.
% --- Otherwise, executes on mouse press in 5 pixel border or over popupmenu1.
function popupmenu1_ButtonDownFcn(hObject, eventdata, handles)
% hObject    handle to popupmenu1 (see GCBO)
% eventdata  reserved - to be defined in a future version of MATLAB
% handles    structure with handles and user data (see GUIDATA)


% --- Executes during object creation, after setting all properties.
function axes1_CreateFcn(hObject, eventdata, handles)
% hObject    handle to axes1 (see GCBO)
% eventdata  reserved - to be defined in a future version of MATLAB
% handles    empty - handles not created until after all CreateFcns called

% Hint: place code in OpeningFcn to populate axes1


% --- Executes during object creation, after setting all properties.
function axes2_CreateFcn(hObject, eventdata, handles)
% hObject    handle to axes2 (see GCBO)
% eventdata  reserved - to be defined in a future version of MATLAB
% handles    empty - handles not created until after all CreateFcns called

% Hint: place code in OpeningFcn to populate axes2


% --- Executes on mouse press over axes background.
function axes2_ButtonDownFcn(hObject, eventdata, handles)

% hObject    handle to axes2 (see GCBO)
% eventdata  reserved - to be defined in a future version of MATLAB
% handles    structure with handles and user data (see GUIDATA)


% --- Executes during object deletion, before destroying properties.
function axes2_DeleteFcn(hObject, eventdata, handles)
% hObject    handle to axes2 (see GCBO)
% eventdata  reserved - to be defined in a future version of MATLAB
% handles    structure with handles and user data (see GUIDATA)


% --- Executes during object creation, after setting all properties.
function uitable2_CreateFcn(hObject, eventdata, handles)
% hObject    handle to uitable2 (see GCBO)
% eventdata  reserved - to be defined in a future version of MATLAB
% handles    empty - handles not created until after all CreateFcns called


% --- Executes when figure1 is resized.
function figure1_SizeChangedFcn(hObject, eventdata, handles)
% hObject    handle to figure1 (see GCBO)
% eventdata  reserved - to be defined in a future version of MATLAB
% handles    structure with handles and user data (see GUIDATA)


% --- Executes on key press with focus on popupmenu1 and none of its controls.
function popupmenu1_KeyPressFcn(hObject, eventdata, handles)
% hObject    handle to popupmenu1 (see GCBO)
% eventdata  structure with the following fields (see MATLAB.UI.CONTROL.UICONTROL)
%	Key: name of the key that was pressed, in lower case
%	Character: character interpretation of the key(s) that was pressed
%	Modifier: name(s) of the modifier key(s) (i.e., control, shift) pressed
% handles    structure with handles and user data (see GUIDATA)


% --------------------------------------------------------------------
function uitable2_ButtonDownFcn(hObject, eventdata, handles)
% hObject    handle to uitable2 (see GCBO)
% eventdata  reserved - to be defined in a future version of MATLAB
% handles    structure with handles and user data (see GUIDATA)


% --- Executes on button press in pushbutton5.
function pushbutton5_Callback(hObject, eventdata, handles)
% hObject    handle to pushbutton5 (see GCBO)
% eventdata  reserved - to be defined in a future version of MATLAB
% handles    structure with handles and user data (see GUIDATA)


% --- Executes on button press in pushbutton6.
function pushbutton6_Callback(hObject, eventdata, handles)
% hObject    handle to pushbutton6 (see GCBO)
% eventdata  reserved - to be defined in a future version of MATLAB
% handles    structure with handles and user data (see GUIDATA)


% --- Executes on button press in pushbutton7.
function pushbutton7_Callback(hObject, eventdata, handles)
% hObject    handle to pushbutton7 (see GCBO)
% eventdata  reserved - to be defined in a future version of MATLAB
% handles    structure with handles and user data (see GUIDATA)


% --- Executes on button press in togglebutton1.
function togglebutton1_Callback(hObject, eventdata, handles)
% hObject    handle to togglebutton1 (see GCBO)
% eventdata  reserved - to be defined in a future version of MATLAB
% handles    structure with handles and user data (see GUIDATA)

% Hint: get(hObject,'Value') returns toggle state of togglebutton1
Allegati:
 23811_fdb4ca30473aa7146bee6b7ed53c2e93.png