giug ha scritto:
Bella domanda...
ce ne sono? j arriva a 3?
s = 3, ma lui non ne fa passare prima, quando fa la storia della collimazione... bho?
però questo dopo, adesso c'è la legenda che rompe.
Se io scrivo:
figure()

%%%%voglio fare un plot tenendo fisse le dimensioni delle icone nella legenda
    cmap = hsv(stati);  %# Creates a j-by-3 set of colors from the HSV colormap

    legendtext ='';

 ion_sym = input ('Simbolo ione da simulare: ', 's');

for j=1:s

    for i=1:p

         if (Part_trasp(i).ionizzazione == j)

            B_defl(i) = Part_trasp(i).traiettoria(end,2);
            E_defl(i) = Part_trasp(i).traiettoria(end,1);

           hplot(j) = plot(B_defl(:,j), E_defl(:,j),'*','Color',cmap(j,:),'Markersize', 10);
                                              %'Color',cmap(j,:)  %# Plot each column with a different color
           hold on

         end

    end

       legendtext = [legendtext; ion_sym, '^{', num2str(j),'+}'];

    %hold on

end

hold on
plot(Ymcporigine,Xmcporigine,'k-','MarkerEdgeColor','k','MarkerSize',1);  %Plot contorno MCP


     %Label assi principali - It is necessary to give the label instructions after plot in order to avoid overlap
    xlabel(gca, 'Deflessione magnetica [m]'); % label lower x axis
    ylabel(gca,'Deflessione elettrica [m]');  %label left y axis

    %particles outside MCP radius won't appear in figure
    xlim([0, Rmcp])
    ylim([0, Rmcp])

%     %%%% legenda assi principali
    l=legend(legendtext, 'Location', 'BestOutside');
    a=get(l, 'children');
    set(a(1:3:end),'MarkerSize', 10);
% %
%   %%%% doppi Assi

    %set secondary x limit as the momentum of a H+ at distance equal to the MCP radius
    % Secondo Harres y=(q*B*LB*L)/sqrt(2mEkin) ==> mv=q*B*LB*L/y
    %L=Deriva2;
    L=0.46;
    CB=0.006;
    mv_max = (q*CB*LB*L)/Rmcp;
    %mv_max = 1;

    %set secondary y limit as the energy of a H+ at distance equal to the MCP radius
    % Secondo Harres x=(q*E*Le*L)/(2Ekin) ==> Ekin=q*E*Le*L/2x
    Le = 0.07; %Estensione del C.E.  : 70 mm
    CE = 100000; %campo TP.m
    Ekin_max = ((q*CE*Le*L)/(2*Rmcp))/eV;
    %mv_max = 1;

    %Layout instruction
    set(gca,'Box','off');   % Turn off the box surrounding the whole axes
    axesUnits=get(gca,'Units');
    axesPosition = get(gca,'Position');          %# Get the current axes position
    hNewAxes = axes('Position', axesPosition,...  %# Place a new axes on top...
        'Units', 'normalized',...
        'ActivePositionProperty', 'Position',... %prova anche OuterPosition
        'Color','none',...           %#   ... with no background color
        'YAxisLocation', 'right',...
        'XAxisLocation','top',...    %#   ... located on the top
        'Ylim', [0, Ekin_max],...
        'Xlim', [0, mv_max],...      %#   ... should define x axis scale (need to set xmax = mv_max)
        'Box','off');                %#   ... and no surrounding box

    xlabel(hNewAxes,'Momentum (H^+)');  %# Add a label to the top axis
    ylabel(hNewAxes,'Energy (H^+)');  %# Add a label to the right axis
    set(gca, 'XTickLabel', num2str(get(gca,'XTick')','%g'))
    set(gca, 'YTickLabel', num2str(get(gca,'YTick')','%g'))
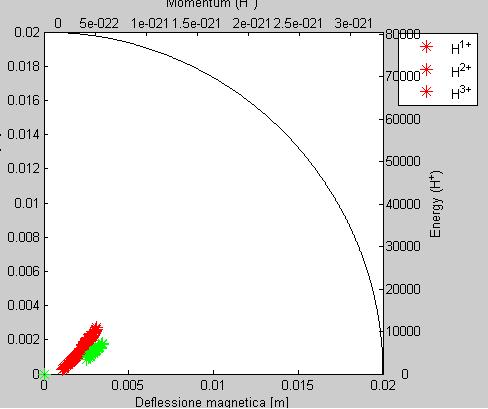
lui mi fa i marker della legenda tutti dello stesso colore, almeno credo...(allegato screenshot)
Se la metto prima lui mi fa una legenda dove compaiono tutte le particelle, una striscia lunghissima....
BASTAAAA!!
Allegati:
 9724_6e47f9408d2f0752007c85803557b47b.jpg