Il modo più semplice per creare una GUI è usare il tool GUIDE che si apre digitando il comando "
guide" dalla Command WIndow.
Una volta aperto, selezionare "
Create New GUI"
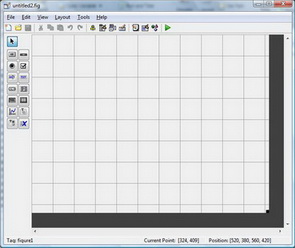
GUIDE appare quindi così:
 tool_guide.jpg
Sulla toolbar a sinistra sono disponibili gli
oggetti (uicontrols) che si possono inserire nella GUI (pushbuttons, check box, ...)
Si costruisce quindi la GUI posizionando gli uicontrol nella canvas (l'area a sistra della toolbar)
Con un doppio click su un uicontrol apre la finestra nella quale se ne possono modificare le proprietà.
Una proprietà importante è "
Tag": identifica il "nome" dell'uicontrol.
Un'altra proprietà notevole è "
Unit": settata "
Normalized" ed in abbinamento con la proprietà "
Resize" della "figure" (il pannello relativo si apre con doppio click in un punto della canvas nel quale non ci sono uicntrols) settata "
on" consente di modificare le dimensioni della finesta (della GUI) in modo che le dimensioni degli uicontrols si adattino automaticamente.
Una terza è "
String" che definisce la stringa che comparirà sull'uicontrol (es. la stringa che compare sul pushbutton)
Salvando la GUI creata viene generato un file "
.fig" che contiene essenzialmente le informazioni grafiche ed un file "
.m" che contiene la funzione che, lanciata dalla Command WIndow "aprirà" la GUI.
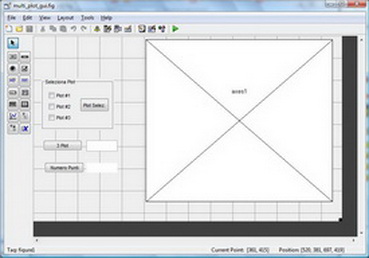
In base a quanto riportato nella domanda:
 multi_plot.jpg
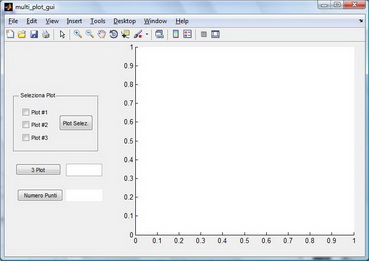
La GUI, lanciata dalla Command Window ha il seguente aspetto:
 multi_plot_1.jpg
Una volta creata l'interfaccia grafica si passa alla definizione delle
callbacks (le azioni che devono essere eseguire quando, ad esempio, si preme un pushbutton (in pratica, gli script che devono essere eseguiti)
Per fare questo si deve aprire il file ".m" generato automaticamente dal tool GUIDE.
In base alla GUI creata:
function varargout = multi_plot_gui(varargin)
% MULTI_PLOT_GUI MATLAB code for multi_plot_gui.fig
%      MULTI_PLOT_GUI, by itself, creates a new MULTI_PLOT_GUI or raises the existing
%      singleton*.
%
%      H = MULTI_PLOT_GUI returns the handle to a new MULTI_PLOT_GUI or the handle to
%      the existing singleton*.
%
%      MULTI_PLOT_GUI('CALLBACK',hObject,eventData,handles,...) calls the local
%      function named CALLBACK in MULTI_PLOT_GUI.M with the given input arguments.
%
%      MULTI_PLOT_GUI('Property','Value',...) creates a new MULTI_PLOT_GUI or raises the
%      existing singleton*.  Starting from the left, property value pairs are
%      applied to the GUI before multi_plot_gui_OpeningFcn gets called.  An
%      unrecognized property name or invalid value makes property application
%      stop.  All inputs are passed to multi_plot_gui_OpeningFcn via varargin.
%
%      *See GUI Options on GUIDE's Tools menu.  Choose "GUI allows only one
%      instance to run (singleton)".
%
% See also: GUIDE, GUIDATA, GUIHANDLES

% Edit the above text to modify the response to help multi_plot_gui

% Begin initialization code - DO NOT EDIT
gui_Singleton = 1;
gui_State = struct('gui_Name',       mfilename, ...
                   'gui_Singleton',  gui_Singleton, ...
                   'gui_OpeningFcn', @multi_plot_gui_OpeningFcn, ...
                   'gui_OutputFcn',  @multi_plot_gui_OutputFcn, ...
                   'gui_LayoutFcn',  [] , ...
                   'gui_Callback',   []);
if nargin && ischar(varargin{1})
    gui_State.gui_Callback = str2func(varargin{1});
end

if nargout
    [varargout{1:nargout}] = gui_mainfcn(gui_State, varargin{:});
else
    gui_mainfcn(gui_State, varargin{:});
end
% End initialization code - DO NOT EDIT


% --- Executes just before multi_plot_gui is made visible.
function multi_plot_gui_OpeningFcn(hObject, eventdata, handles, varargin)
% This function has no output args, see OutputFcn.
% hObject    handle to figure
% eventdata  reserved - to be defined in a future version of MATLAB
% handles    structure with handles and user data (see GUIDATA)
% varargin   command line arguments to multi_plot_gui (see VARARGIN)

% Choose default command line output for multi_plot_gui
handles.output = hObject;

% Update handles structure
guidata(hObject, handles);

% UIWAIT makes multi_plot_gui wait for user response (see UIRESUME)
% uiwait(handles.figure1);


% --- Outputs from this function are returned to the command line.
function varargout = multi_plot_gui_OutputFcn(hObject, eventdata, handles)
% varargout  cell array for returning output args (see VARARGOUT);
% hObject    handle to figure
% eventdata  reserved - to be defined in a future version of MATLAB
% handles    structure with handles and user data (see GUIDATA)

% Get default command line output from handles structure
varargout{1} = handles.output;


% --- Executes on button press in Plot_1.
function Plot_1_Callback(hObject, eventdata, handles)
% hObject    handle to Plot_1 (see GCBO)
% eventdata  reserved - to be defined in a future version of MATLAB
% handles    structure with handles and user data (see GUIDATA)

% Hint: get(hObject,'Value') returns toggle state of Plot_1


% --- Executes on button press in Plot_2.
function Plot_2_Callback(hObject, eventdata, handles)
% hObject    handle to Plot_2 (see GCBO)
% eventdata  reserved - to be defined in a future version of MATLAB
% handles    structure with handles and user data (see GUIDATA)

% Hint: get(hObject,'Value') returns toggle state of Plot_2


% --- Executes on button press in Plot_3.
function Plot_3_Callback(hObject, eventdata, handles)
% hObject    handle to Plot_3 (see GCBO)
% eventdata  reserved - to be defined in a future version of MATLAB
% handles    structure with handles and user data (see GUIDATA)

% Hint: get(hObject,'Value') returns toggle state of Plot_3


% --- Executes on button press in numeropuntitot.
function numeropuntitot_Callback(hObject, eventdata, handles)
% hObject    handle to numeropuntitot (see GCBO)
% eventdata  reserved - to be defined in a future version of MATLAB
% handles    structure with handles and user data (see GUIDATA)


function edit1_Callback(hObject, eventdata, handles)
% hObject    handle to edit1 (see GCBO)
% eventdata  reserved - to be defined in a future version of MATLAB
% handles    structure with handles and user data (see GUIDATA)

% Hints: get(hObject,'String') returns contents of edit1 as text
%        str2double(get(hObject,'String')) returns contents of edit1 as a double


% --- Executes during object creation, after setting all properties.
function edit1_CreateFcn(hObject, eventdata, handles)
% hObject    handle to edit1 (see GCBO)
% eventdata  reserved - to be defined in a future version of MATLAB
% handles    empty - handles not created until after all CreateFcns called

% Hint: edit controls usually have a white background on Windows.
%       See ISPC and COMPUTER.
if ispc && isequal(get(hObject,'BackgroundColor'), get(0,'defaultUicontrolBackgroundColor'))
    set(hObject,'BackgroundColor','white');
end


% --- Executes on button press in Run_3_plot.
function Run_3_plot_Callback(hObject, eventdata, handles)
% hObject    handle to Run_3_plot (see GCBO)
% eventdata  reserved - to be defined in a future version of MATLAB
% handles    structure with handles and user data (see GUIDATA)


% --- Executes on button press in Plot_sel.
function Plot_sel_Callback(hObject, eventdata, handles)
% hObject    handle to Plot_sel (see GCBO)
% eventdata  reserved - to be defined in a future version of MATLAB
% handles    structure with handles and user data (see GUIDATA)


% --- Executes when uipanel2 is resized.
function uipanel2_ResizeFcn(hObject, eventdata, handles)
% hObject    handle to uipanel2 (see GCBO)
% eventdata  reserved - to be defined in a future version of MATLAB
% handles    structure with handles and user data (see GUIDATA)
Le callback associate a ciascun uicontrol sono identificate in base alla stringa assegnata alla proprietà "Tag" (vedi sopra):
Es. al pushbutton "3 Plot" è stata associato i Tag "Run_3_plot" per cui la callback nel file ".m" sarà:
"
function Run_3_plot_Callback(hObject, eventdata, handles)"
qui va inserito il codice eseguire quando verrà prenuto il pushbutton; il codice può essere scritto direttamente o si può inserire il nome del file ".m" nel quale è stato precedentemente scritto (come sembra essere nel caso della domanda).
Per verificare lo "stato" di uicontrols come ad esempio gli "
checkbox" si può utilizzare il relativo handle che è disponibile all'interno della strutture "handles" (che è uno dei parametri passato a tutte le funzioni - vedi sopra).
"handles" è una struttura che contiene, tra gli altri, gli handles dei vari uicontrols che sono stati inseriti.
Tramite essi si accede alle proprietà degli uiocontrol stessi: ad esempio, per verificare se un checkbos è stato selezionato:
get(handles.Plot_1,'value')
Nella GUI è stato inserito un solo sistema di assi cartesiani, dalla domanda non è chiaro se i vari plot richiesti debbano essere effettuati in un unico grafico (hold on) od in assi diversi (ad esempio "
subplot").
Nel secondo caso, nel costruire la GUI dovranno essere definiti "
n" assi cartesiani (tramite la toolbar alla sinistra del tool GUIDE.
L'help di MatLab (doc guide) contiene dettagliate in formazioni sulla creazione e gestione delle GUI, altre informazioni es esempi si possono trovare facilmente in Internet.
Hope this helps.