Le barre vengono disegnate come "patch".
Dato il grafico, puoi usare la funzione "findobj" per ottenere l'handle delle patches:
% Get the handle of the patches
p=findobj('type','patch')
A questo punto, tramite l'handle puoi ottenere gli indici delle patches ed i valori dei relativi vertici:
% Get the indices of the faces of the patches
f=get(p,'faces')
% Get the values of the vertices of the patches
v=get(p,'vertices')
dal momento che ogni patch è un rettangolo, ognuna avrà 4 vertici; puoi quindi calcolare quante patches ci sono nel grafico:
% Compute the number of patches
n_patch=size(v,1)/4
A questo punto non ti resta che ri-plottare le patches una ad una specificando il colore (nell'esempio, un colore random)
hold on
% Re-plot the patches
for i=1:n_patch
   % Define a random color
   c_set=rand(1,3)
   % Plot the i-th patch
   np=patch('faces',[1:4],'vertices',v(f(i,:),:),'facecolor',c_set)
end
Ultimo passo, cancellare le patches originali:
% Delete the original pathces
delete(p)
Di seguito il codice completo.
ATTENZIONE: testato solo con Octave, potrebbe darsi che ci sia qualche incongruenza con MatLab, ma l'approccio dovrebbe essere corretto.
% Plot a pareto chart
Cheese = {"Cheddar", "Swiss", "Camembert", ...
                    "Munster", "Stilton", "Blue"};
Sold = [105, 30, 70, 10, 15, 20];
p=pareto (Sold, Cheese);
% Get the handle of the patches
p=findobj('type','patch')
% Get the indices of the faces of the patches
f=get(p,'faces')
% Get the values of the vertices of the patches
v=get(p,'vertices')
% Compute the number of patches
n_patch=size(v,1)/4
% Re-plot the patches
hold on
for i=1:n_patch
   % Define a random color
   c_set=rand(1,3)
   % Plot the i-th patch
   np=patch('faces',[1:4],'vertices',v(f(i,:),:),'facecolor',c_set)
end
% Delete the original pathces
delete(p)
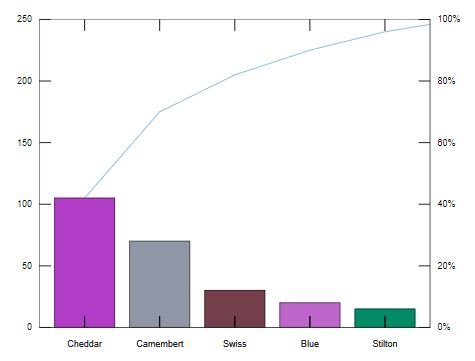 pareto.JPG